| STK12与Python联合仿真(三):分析星座覆盖性能 | 您所在的位置:网站首页 › 探索PyImGui › STK12与Python联合仿真(三):分析星座覆盖性能 |
STK12与Python联合仿真(三):分析星座覆盖性能
|
分析星座覆盖性能 打开STK,连接到工程创建种子星 (STK)创建种子星 (Python)生成星座Python 创建覆盖网格绑定卫星的传感器建立星座定义多重网格计算与绘图结语
打开STK,连接到工程
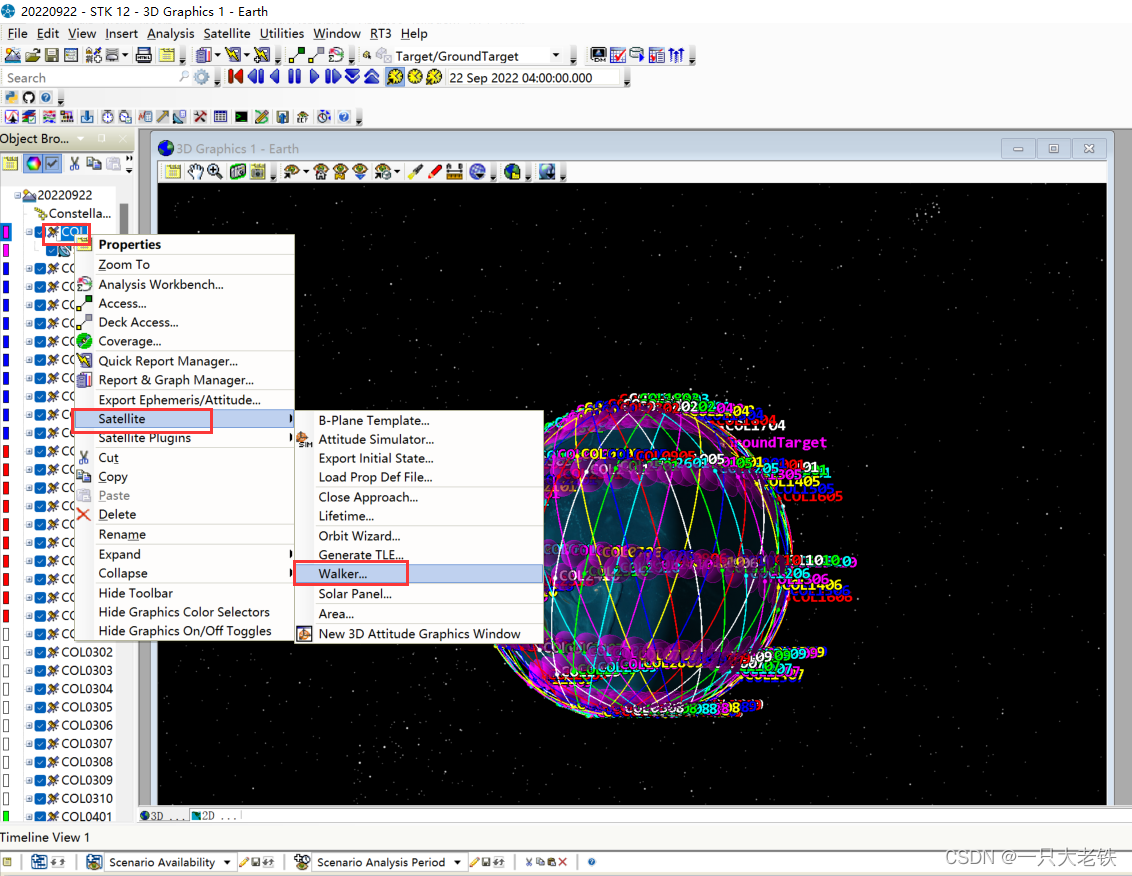
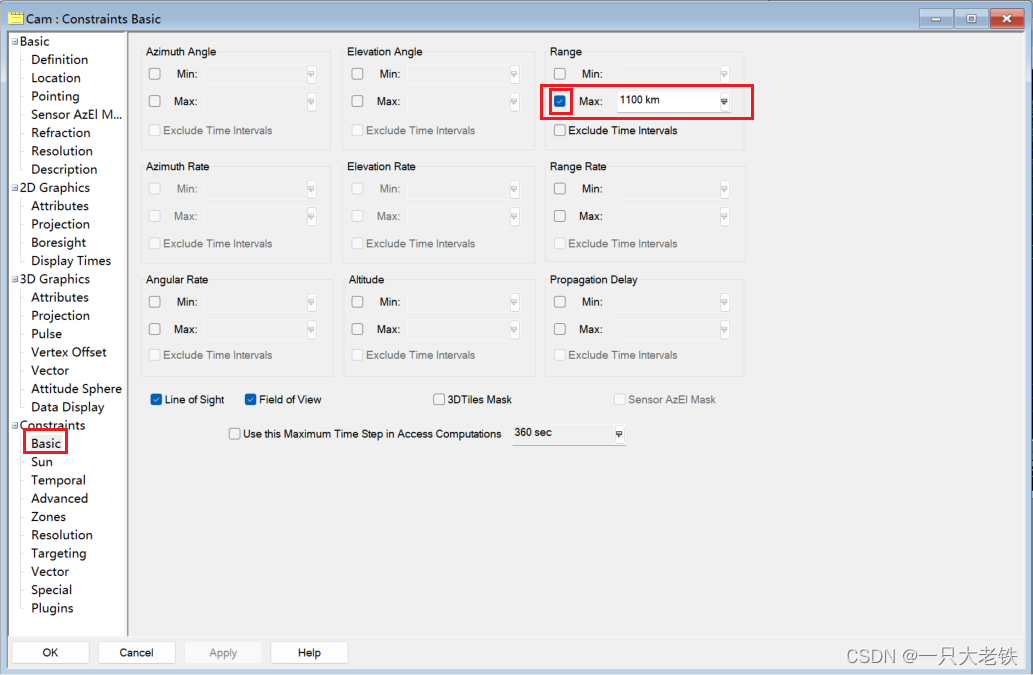
jupyter: 导入相关的包 from agi.stk12.stkdesktop import STKDesktop from agi.stk12.stkobjects import * from agi.stk12.stkutil import * from agi.stk12.vgt import * import os链接STK STK_PID = 5600 # 根据自己刚刚得到的PID stk = STKDesktop.AttachToApplication(pid=int(STK_PID)) # stk = STKDesktop.StartApplication(visible=True) #using optional visible argument root = stk.Root print(type(root)) scenario = root.CurrentScenario # 链接当前场景 创建种子星 (STK)这里我在STK手动建立了高度600km,倾角75° 的种子卫星,并携带了对地观测角80°的传感器 然后建立Wakler星座 这里解释一下约束 首先https://help.agi.com/stkdevkit/Content/DocX/STKObjectsEnumerationsAgEAccessConstraints_EN.html 这里解释sensor.AccessConstraints.AddConstraint(34)是IAgAccessCnstrMinMax的Range 类型 因此要接入STKObjects.IAgAccessCnstrMinMax,然后LOS.EnableMax对应的是图中的可选框,是否激活 LOS.Max = 1100表示设定的值 比如LOS.EnableMin = True LOS.Min = 10
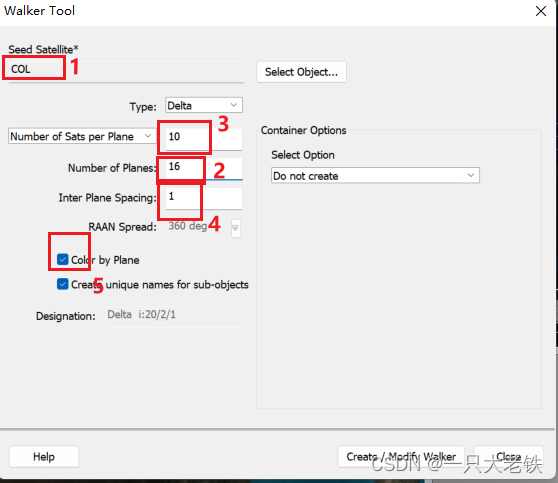
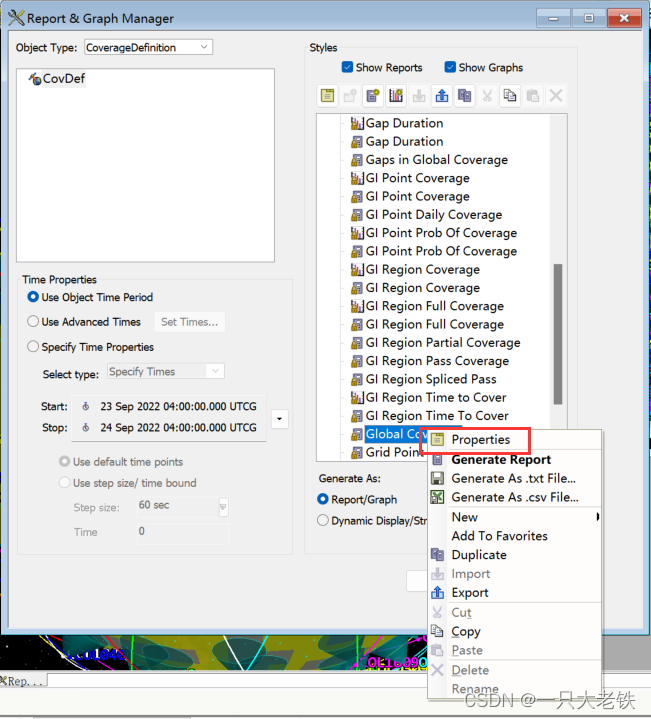
生成星座只需要一个命令, root.ExecuteCommand(‘Walker */Satellite/COL Type Delta NumPlanes 16 NumSatsPerPlane 10 InterPlanePhaseIncrement 1 ColorByPlane Yes’);在‘Walker */Satellite/COL Type Delta NumPlanes 16 NumSatsPerPlane 10 InterPlanePhaseIncrement 1 ColorByPlane Yes’ 这里面中,COL是种子卫星的平面,往后的参数依次是 轨道平面数、每轨道卫星数、轨道相位因子,对应STK如下 这里对应STK的 这里分别对应 将所有传感器塞入 for j in sensor_list:covdef.AssetList.Add(j) 建立星座 sate_constellation = scenario.Children.New(AgESTKObjectType.eConstellation,'COL') for obj in tqdm(all_list):sate_constellation.Objects.Add(obj) 定义多重网格有时候我们需要分析不同高度的覆盖性能,但是手动添加太过繁琐,一下例程演示0-300km,采样间隔10km的网格创建。 并把不同网格放在一个列表里 covdef_lits = [] for i in range(0,310,10):_string = 'CovDef' + str(i)covdef = scenario.Children.New(AgESTKObjectType.eCoverageDefinition, _string)covdef.Grid.BoundsType = 6covdef.Grid.Resolution.LatLon = 6covdef.PointDefinition.Altitude = i for j in sensor_list:covdef.AssetList.Add(j)covdef_lits.append(covdef) 计算与绘图 方法变量值描述eFmAccessConstraint0Access Constraint Figure of Merit.eFmAccessDuration1Access Duration Figure of Merit.eFmAccessSeparation2Access Separation Figure of Merit.eFmCoverageTime3Coverage Time Figure of Merit.eFmDilutionOfPrecision4Dilution of Precision Figure of Merit.eFmNAssetCoverage5N Asset Coverage Figure of Merit.eFmNavigationAccuracy6Navigation Accuracy Figure of Merit.eFmNumberOfAccesses7Number of Accesses Figure of Merit.eFmNumberOfGaps8Number of Gaps Figure of Merit.eFmResponseTime9Response Time Figure of Merit.eFmRevisitTime10Revisit Time Figure of Merit.eFmSimpleCoverage11Simple Coverage Figure of Merit.eFmTimeAverageGap12Time Average Gap Figure of Merit.eFmSystemResponseTime13System Response Time Figure of Merit.eFmAgeOfData14Age of Data Figure of Merit.eFmScalarCalculation15Scalar Calculation Figure of Merit.eFmSystemAgeOfData16System Age Of Data Figure of Merit. figmerit1.SetDefinitionType(1) # eFmAccessDuration covdef_tmp.ComputeAccesses(); pov = covdef_tmp.DataProviders.Item('Coverage by Latitude').Exec() # Coverage By Latitude这里对照Reoprt Style 的属性
Python 有很多接口都是整形变量,不像MATLAB可以直接用字符串那么方便,需要自己找对应的变量。 我一般是对照着MATLAB的例程找到一些范式,可以在网站中慢慢找 STK Help 本文所有代码我将上传至我的Github |
 设置36个轨道面,每个轨道面10个星
 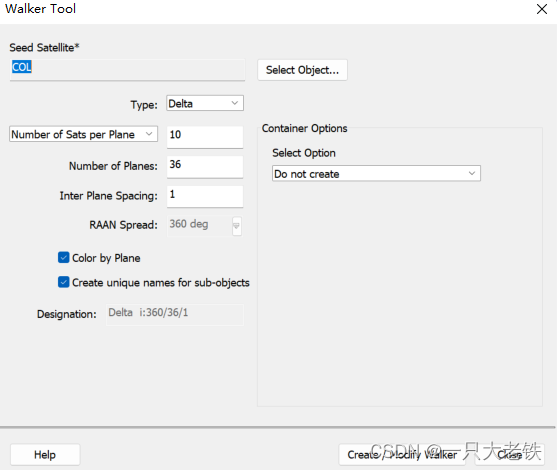 结果如下:
结果如下: 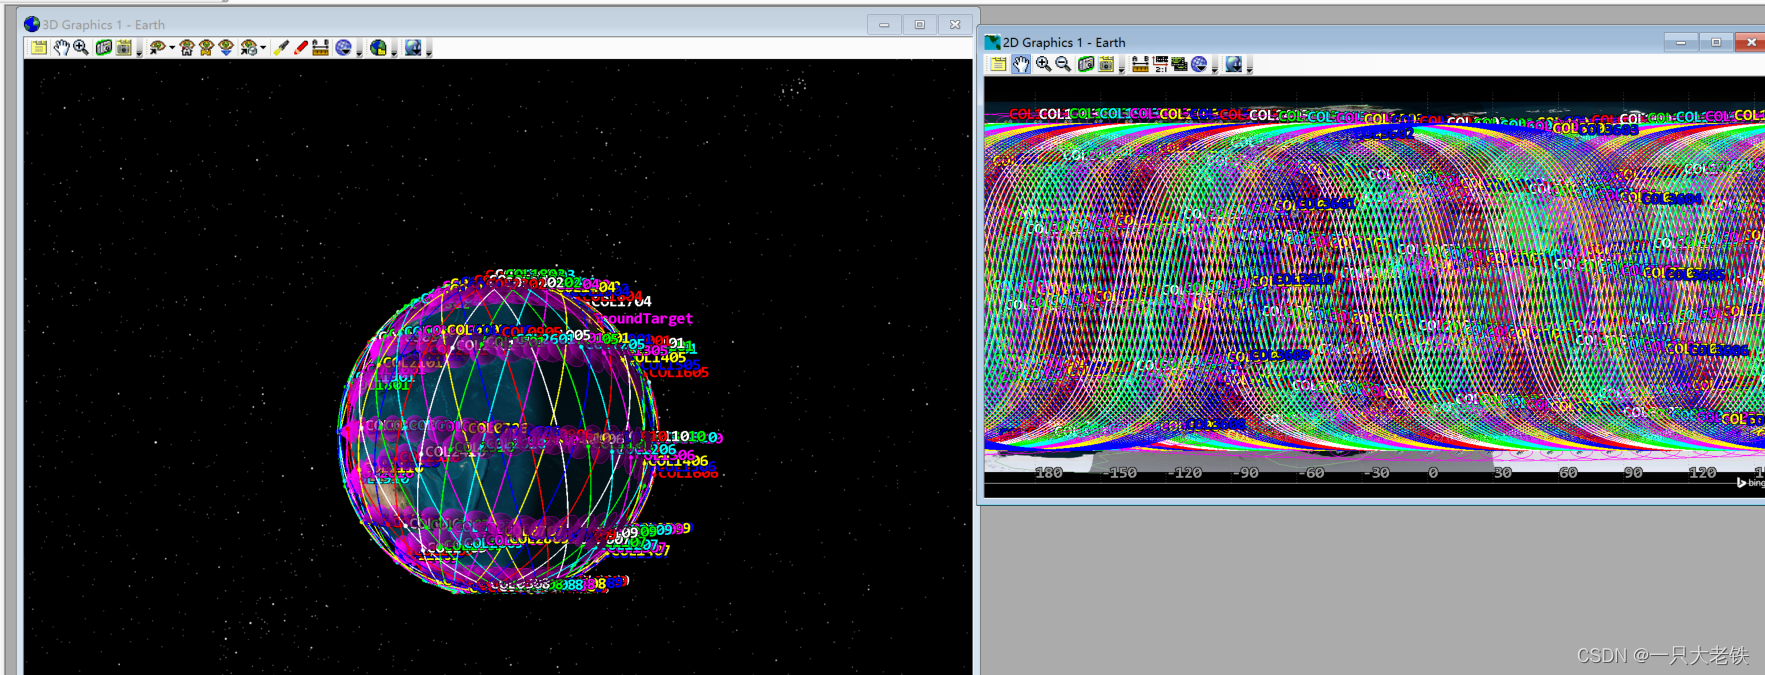
 (这里为了演示能快一点就减少了卫星数量)
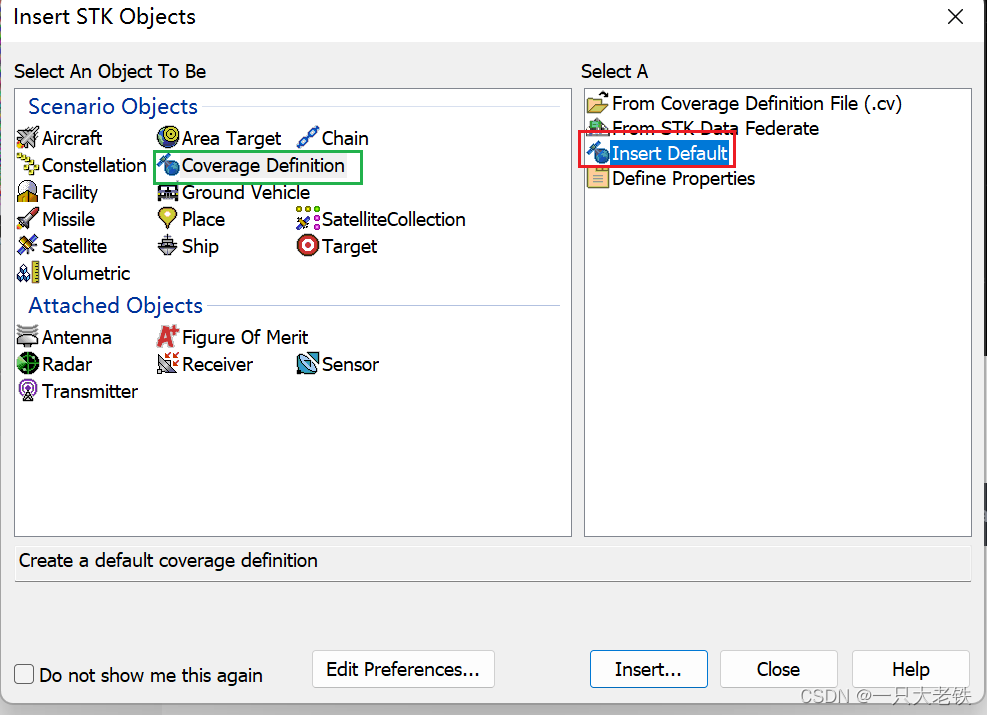 设置 Converage Defination的属性
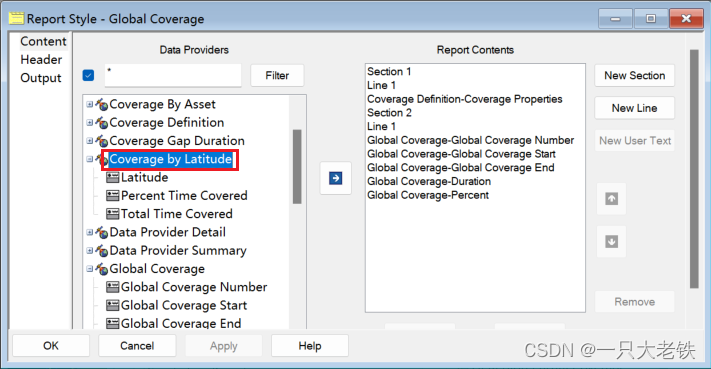
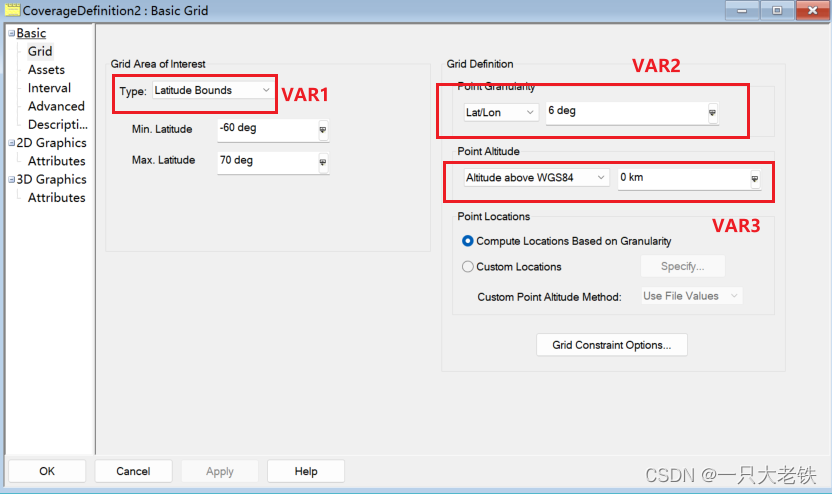
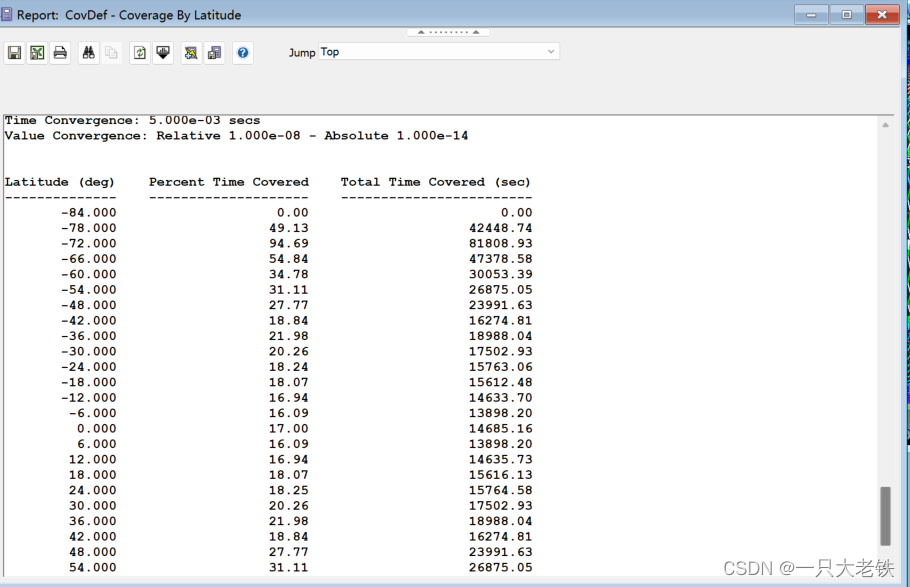
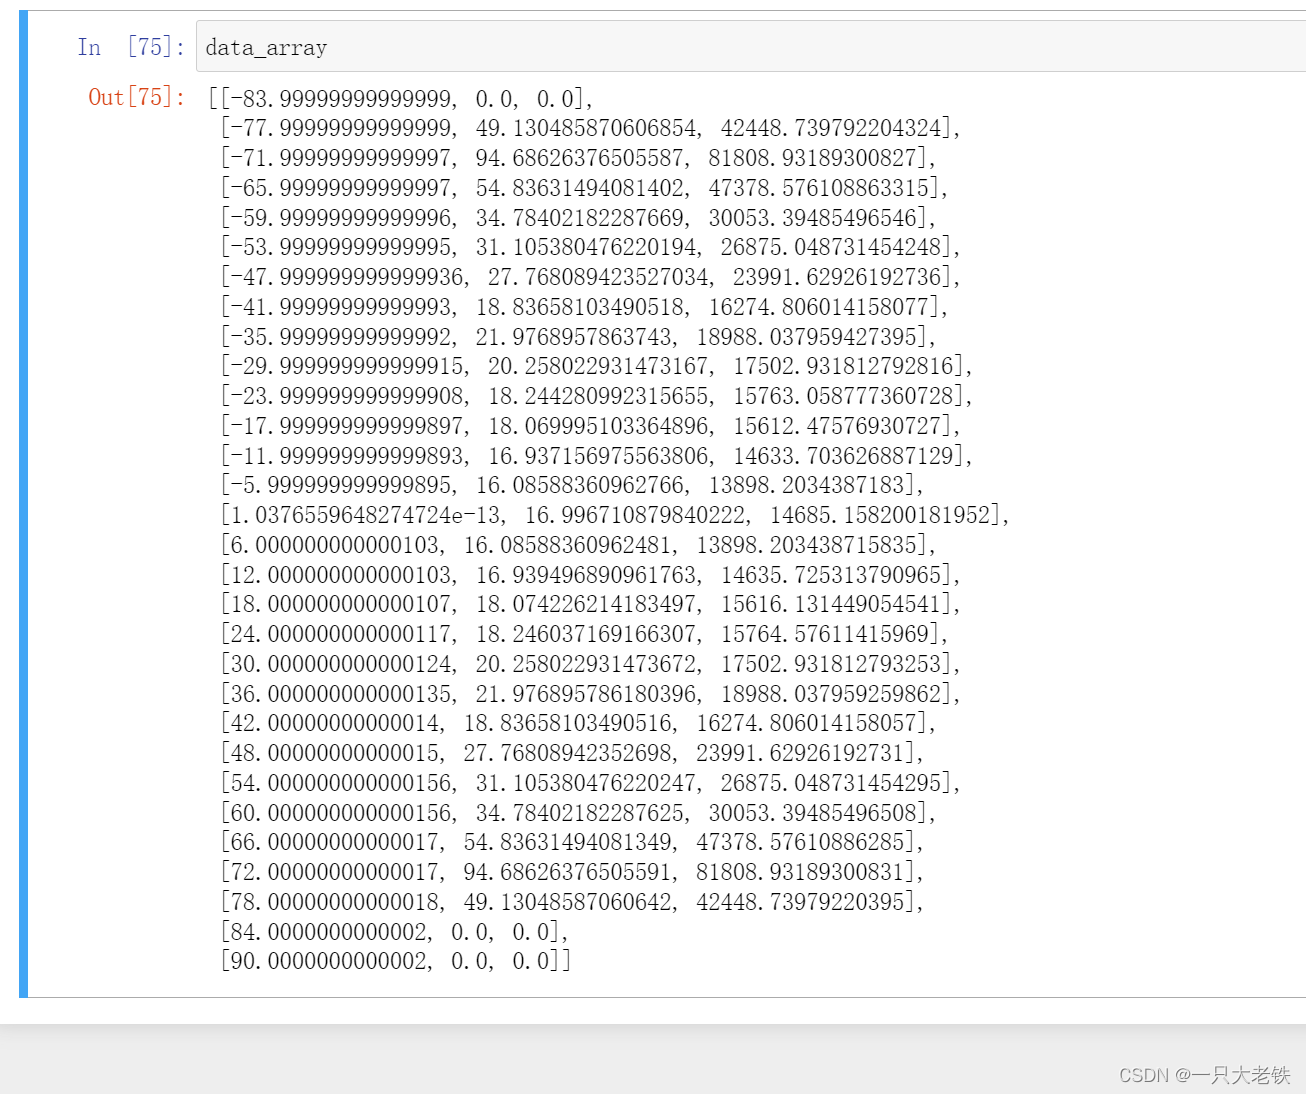 对比STK数据
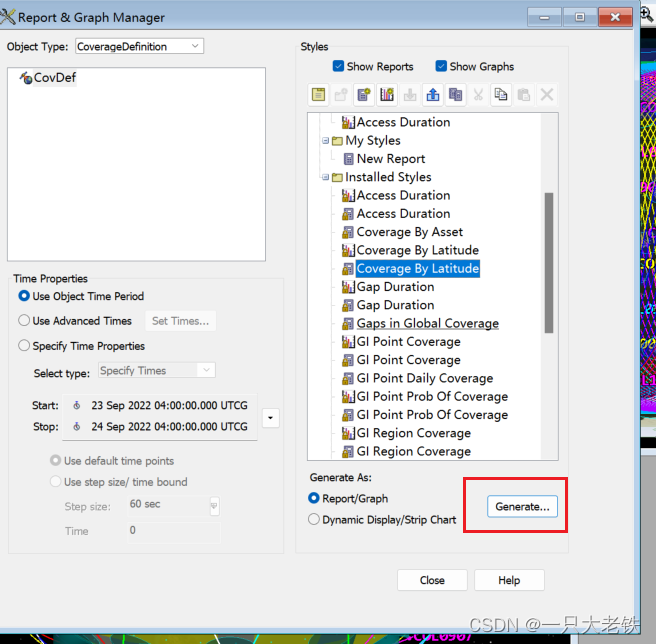
 完成绘图
完成绘图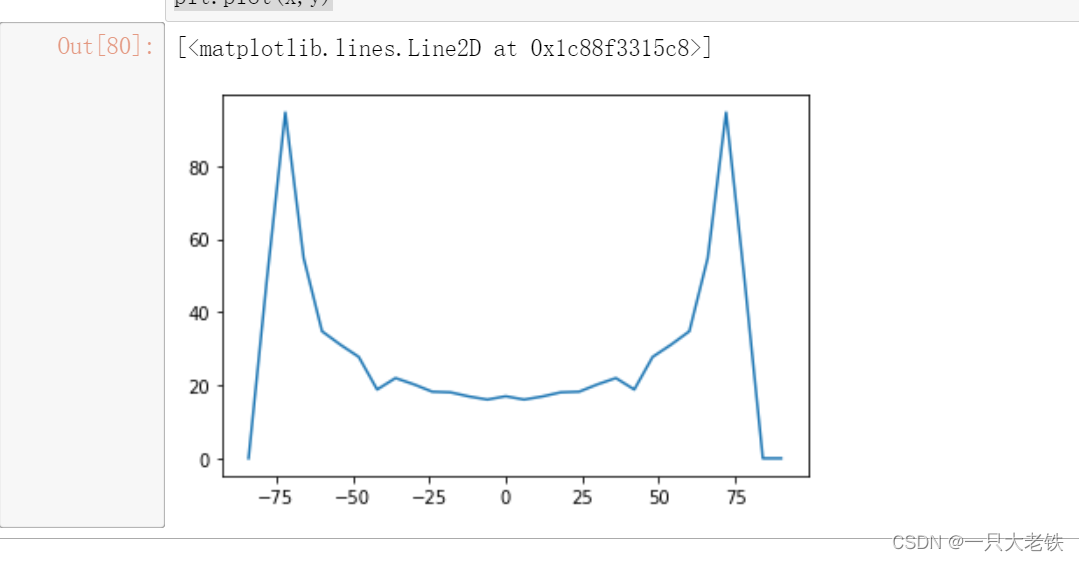 对比STK生成的图
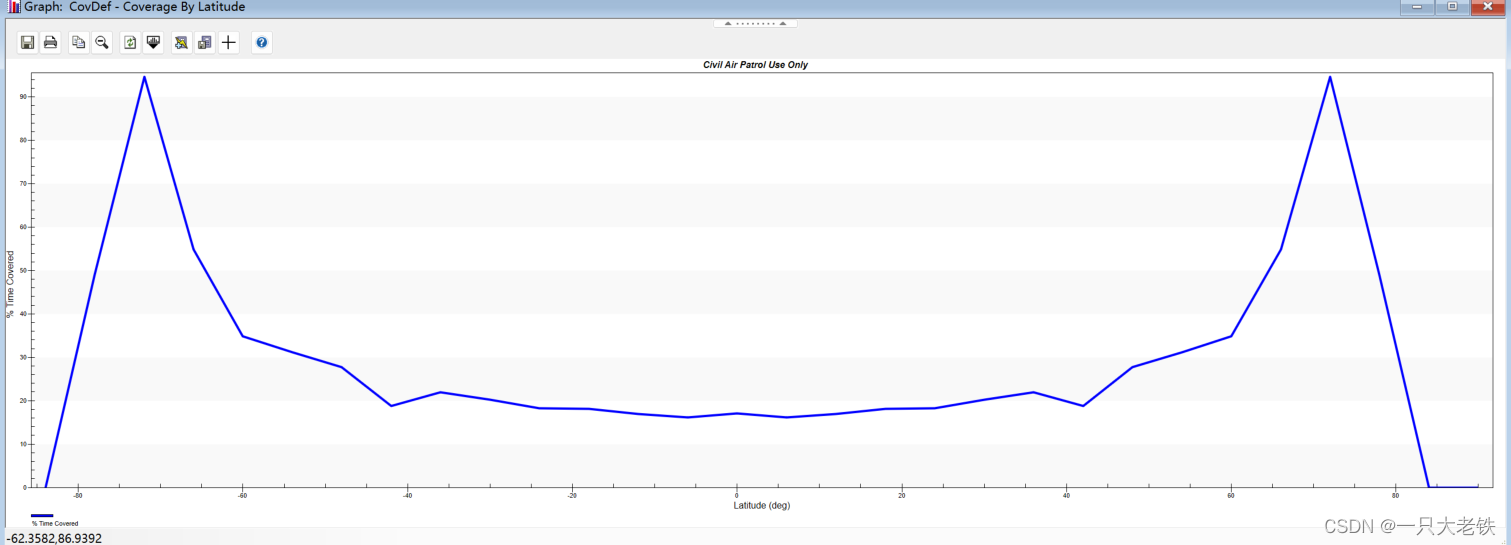
【本文地址】